|
|
|
The Risk Management Safety Net:
II. The Federal Crop Insurance Portfolio Today
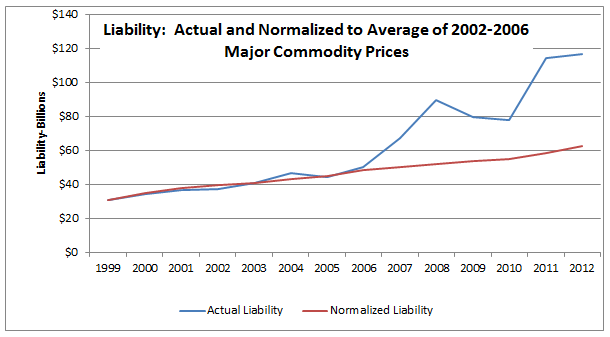
Federal crop insurance covered nearly $117 billion of liability across all crops (excluding livestock) in 2012, more than three times higher than the $34.4 billion liability in 2000. Premium in 2012 totaled nearly $11.1 billion and crop insurance paid $17.2 billion in indemnities to producers following the severe drought and flood conditions across the U.S. during the spring and summer. Because of the widespread utilization of crop insurance, producers were able to continue farming without requests for ad-hoc disaster assistance.
Commodity prices for many crops have increased substantially since 2008, which is naturally reflected in the liability numbers. In order to look at the amount of growth in the Federal crop insurance program without the effects of price changes, the following chart shows liability normalized to average prices between 2002 and 2006 for the major commodities. Commodity prices used for the normalization process include those for barley, corn, cotton, rice, sorghum, soybeans, and wheat. This chart shows Federal crop insurance liability and normalized liability, illustrating that even without considering price, Federal crop insurance liability has more than doubled since 2000.
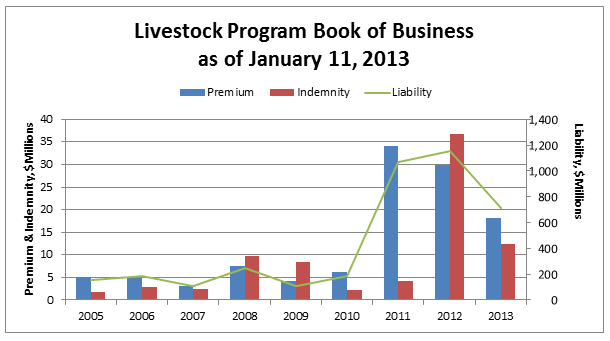
Authorization for the Federal Crop Insurance Corporation to provide livestock insurance was first put into place with the Agricultural Risk Protection Act of 2000. The following table shows the coverage since 2005 for all livestock programs. Market potential for livestock is limited at this time because livestock programs are statutorily limited in the Federal Crop Insurance Act by an insurance expense limitation of $20 million per Fiscal Year. Livestock insurance expenses include premium subsidy paid on behalf of producers and administrative and operating subsidy paid to insurance companies to sell and service the products.
 Program Growth: The Number of Crops Insured and Crop/Type Programs
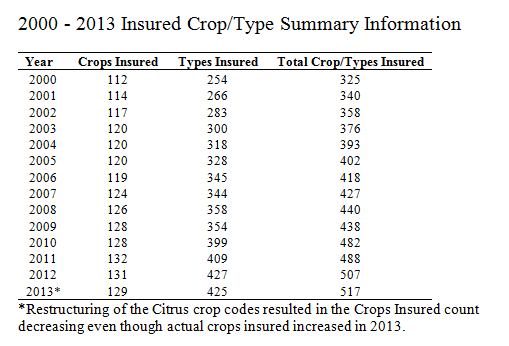
The Federal crop insurance program has seen significant growth in both crops covered and insurable crop types since 2000. The number of crops insured by Federal crop insurance increased 15 percent from 2000 to 2013 to 129 insurable crops. The number of insurable crop/type combinations, at 517 in 2013, increased 59 percent from 2000 to 2013. Additionally, in states and counties where Adjusted Gross Revenue (AGR) and Adjusted Gross Revenue-Lite (AGR-Lite) products are available, all commodities on the farm are covered. The following table shows the growth of insurance program offers by year since 2000 and includes all crops and livestock.
Contact Information
For more information, contact RMA Public Affairs.
|