|
|
|
The Risk Management Safety Net: Market Penetration and Potential
II. The Federal Crop Insurance Portfolio Today
Crop Insurance Book of Business
In 2016, Federal crop insurance provided nearly $101 billion of insurance protection (liability) for U.S. agricultural producers across all crops (excluding livestock). This was nearly three times higher than the $34.4 billion of crop insurance protection in place in 2000. Premium in 2016 totaled nearly $9.4 billion and crop insurance paid over $3.7 billion of indemnities to producers. Favorable weather conditions across the U.S. resulted in a 2016 loss ratio (indemnities compared to premium) of 0.40.
While 2016 was a low loss year, there are years like the 2012 crop year, that pose weather challenges that can be devastating to producers if they do not have Federal crop insurance. Drought conditions were severe in 2012 across the U.S. and indemnities of nearly $17.5 billion were paid to producers. Of that $17.5 billion, 83 percent, or nearly $14.5 billion of the losses were caused by the drought conditions. Because crop insurance is highly utilized by producers, ad-hoc disaster assistance to agricultural producers was not necessary, even with the large losses that were seen across the country.
The following table provides Federal crop insurance information for:
- 2000 as a base comparison year
- 2011 as the date of the previous Portfolio Analysis
- 2012 as a high loss year
- 2015 as the year used in this Portfolio analysis for the study of market penetration, and,
- 2016 as the most current year with complete data available.
Federal Crop Insurance: Book of Business for Crops (No Livestock Insurance Included)
| Year |
Policies
Earning
Prem |
Liability |
Premium |
Subsidy |
Indemnity |
Loss
Ratio |
2000 |
1,323,243 |
$34,443,753,124 |
$2,540,163,689 |
$951,191,720 |
$2,594,834,319 |
1.02 |
2011 |
1,151,986 |
$114,209,887,185 |
$11,972,261,003 |
$7,463,376,557 |
$10,869,339,618 |
0.91 |
2012 |
1,174,007 |
$117,159,687,972 |
$11,116,978,988 |
$6,979,362,775 |
$17,451,159,529 |
1.57 |
2015 |
1,204,619 |
$102,512,109,284 |
$9,765,432,103 |
$6,087,547,525 |
$6,307,085,111 |
0.65 |
2016 |
1,159,146 |
$100,516,354,943 |
$9,317,354,439 |
$5,858,839,862 |
$3,737,187,815 |
0.40 |
Data as of July 17, 2017 |
The top ten commodities insured in 2015 and 2016 are shown in the following table:
Federal Crop Insurance: Top 10 Crops by Liability, 2015 and 2016
Rank |
2015
Commodity |
2015
Liability |
Percent
of Total |
2016
Commodity |
2016
Liability |
Percent
of Total |
1 |
Corn |
$40.3 Billion |
39.3% |
Corn |
$39.6 Billion |
38.6% |
2 |
Soybeans |
$24.3 Billion |
23.7% |
Soybeans |
$22.2 Billion |
21.6% |
3 |
Wheat |
$8.4 Billion |
8.2% |
Wheat |
$6.8 Billion |
6.6% |
4 |
Cotton |
$3.0 Billion |
2.9% |
Almonds |
$3.6 Billion |
3.5% |
5 |
Almonds |
$2.9 Billion |
2.8% |
Cotton |
$3.3 Billion |
3.3% |
6 |
Rice |
$1.5 Billion |
1.5% |
Whole Farm
Revenue
Protection |
$2.3 Billion |
2.3% |
7 |
Nursery (FG&C) |
$1.5 Billion |
1.4% |
Rice |
$1.7 Billion |
1.7% |
8 |
Grapes |
$1.5 Billion |
1.4% |
Grapes |
$1.4 Billion |
1.4% |
9 |
Orange Trees |
$1.3 Billion |
1.2% |
Pasture,
Rangeland,
Forage |
$1.4 Billion |
1.4% |
10 |
Apples |
$1.2 Billion |
1.1% |
Nursery (FG&C) |
$1.4 Billion |
1.3% |
| |
ALL OTHERS |
$16.7 Billion |
16.3% |
ALL OTHERS |
$16.9 Billion |
16.4% |
Producer’s Choices for Their Risk Management Safety Net
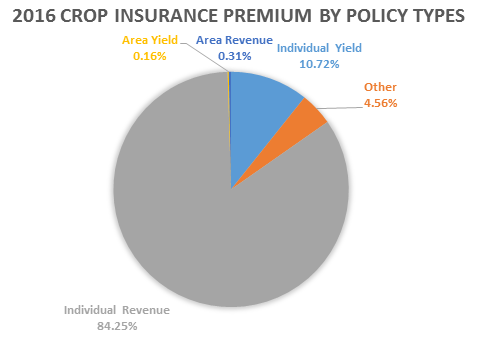
The predominant selection of risk management protection continues to be revenue products, with over 84 percent of total Federal crop insurance premium paid for individual revenue type policies in 2016. The following graphic shows the definite market preference for revenue coverage.
The Risk Management Safety Net in Action: Perils That Caused Losses
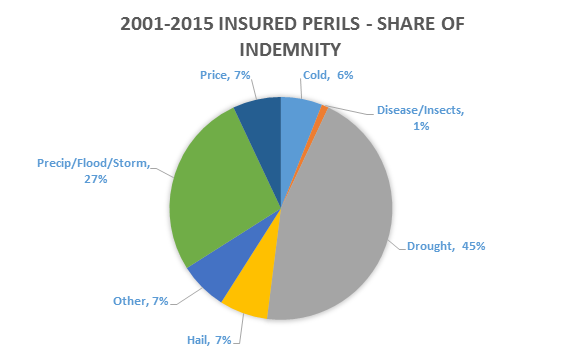
Over the fifteen year period of 2001-2015, which included two serious drought years in the U.S., the following graphic shows the percentage of loss payments that were made for key perils that producers face:
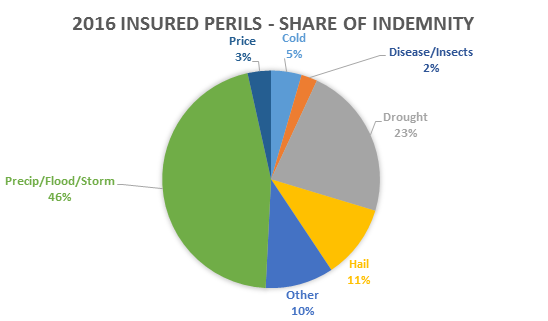
Every loss year is unique as can be seen in the graphic below showing 2016 loss information by peril:
The Use of Crop Insurance by Coverage Level
Producers have increased their risk management safety net protection by purchasing higher coverage levels for their insurance than they did in past years. There are likely several reasons for the increased use of higher coverage levels. Some reasons for increased coverage levels can are increased risks of farming, increased costs of crop inputs, requirements from lenders in obtaining operating loans, and acknowledgment that ad-hoc disaster programs are unlikely.
Until after year 2000, most the majority of policies were sold at the 60-65 percent coverage level range and producers chose coverage levels from 60-75 percent for almost all policies. Today, producers select a risk management safety net using mostly the 75 to 85 percent coverage level ranges, with 48 percent of policies falling in the 70-75 percent range and 31 percent of policies purchased at the 80 to 85 percent coverage levels. The following chart shows the percentage of policies sold at each range of coverage levels for specific years during the program. Note that CAT level coverage was not available until the mid-90s.
Percent of Policies by Coverage Level (Excludes Area-based Programs)
Coverage Level |
1990 |
2000 |
2011 |
2015 |
2016 |
CAT |
N/A |
24% |
7% |
4% |
4% |
50% to 55% |
6% |
5% |
7% |
5% |
5% |
60% to 65% |
68% |
42% |
20% |
13% |
12% |
70% to 75% |
26% |
25% |
49% |
47% |
48% |
80% to 85% |
0% |
4% |
18% |
31% |
31% |
Real Growth of Federal Crop Insurance: Removing Price Variation
To look at the amount of real growth in the Federal crop insurance program without the effect of price changes, the following chart shows liability normalized to average commodity prices that occurred between 2002-2006 for the major commodities, including barley, corn, cotton, rice, sorghum, soybeans, and wheat. The chart shows actual Federal crop insurance liability and normalized liability, illustrating that when the effects of price changes are removed, Federal crop insurance program coverage has steadily grown.
Federal Crop Insurance Growth Shown with the Effects of Price Changes Removed
Liability Normalized** for 2005-2015
| |
2005 |
2006 |
2007 |
2008 |
2009 |
2010 |
2011 |
2012 |
2013 |
2014 |
2015 |
|
Actual Liability |
$44.3 |
$49.9 |
$67.3 |
$89.9 |
$79.5 |
$78.1 |
$114.2 |
$117.1 |
$123.8 |
$109.9 |
$100.3 |
Normalized Liability |
$45.2 |
$48.7 |
$50.3 |
$52.1 |
$54.0 |
$55.2 |
$58.4 |
$62.7 |
$66.2 |
$68.2 |
$68.7 |
Normalized Liability for Individual Crops |
Wheat |
$3.8 |
$4.0 |
$4.2 |
$5.3 |
$4.1 |
$4.1 |
$5.0 |
$4.3 |
$4.7 |
$4.6 |
$4.6 |
Rice |
$0.4 |
$0.4 |
$0.4 |
$0.4 |
$0.5 |
$0.6 |
$0.5 |
$0.5 |
$0.6 |
$0.9 |
$0.9 |
Cotton |
$2.5 |
$2.9 |
$2.0 |
$1.8 |
$1.9 |
$2.3 |
$3.3 |
$2.9 |
$2.6 |
$2.9 |
$2.5 |
Corn |
$14.8 |
$16.5 |
$19.4 |
$17.5 |
$18.9 |
$19.6 |
$21.2 |
$23.3 |
$24.8 |
$23.6 |
$23.9 |
Sorghum |
$0.4 |
$0.4 |
$0.5 |
$0.5 |
$0.4 |
$0.4 |
$0.4 |
$0.4 |
$0.5 |
$0.5 |
$0.6 |
Soybeans |
$9.2 |
$10.1 |
$8.2 |
$9.7 |
$10.6 |
$10.9 |
$10.7 |
$11.5 |
$12.1 |
$13.6 |
$13.9 |
Barley |
$0.2 |
$0.2 |
$0.2 |
$0.2 |
$0.2 |
$0.2 |
$0.2 |
$0.2 |
$0.2 |
$0.2 |
$0.3 |
Other |
$13.8 |
$14.3 |
$15.4 |
$16.8 |
$17.4 |
$17.0 |
$17.1 |
$19.6 |
$20.7 |
$21.9 |
$21.9 |
*Amounts for all crops are in $ billions.
**Normalized Liability reflects the liability if commodity prices were at their 2002-2006 average values. Thus, 'real' growth in the program is due to increases in producer choices of higher coverage levels and amounts of acres or products insured. |
Book of Business for Livestock Insurance
Authorization for the FCIC to provide livestock insurance was first put into place with the Agricultural Risk Protection Act of 2000. Market potential for livestock is limited at this time because expenses for livestock insurance programs are statutorily limited in the Act to $20 million per Fiscal Year. Livestock insurance expenses include premium subsidy paid on behalf of producers, and the administrative and operating subsidy paid on behalf of producers to insurance companies for selling and servicing the products. The $20 million expense capacity limitation is divided amongst the various livestock plans of insurance that are offered to provide equal opportunity to producers for the various types of livestock. In 2015, livestock expense limitations pertained to Livestock Risk Protection (LRP), Livestock Gross Margin (LGM), and the portion expenses attributed to insurance liability from animal and animal products for Whole-Farm Revenue Protection (WFRP) insurance. The table below shows the use of livestock expenses since 2010:
Livestock Expenses for Federal Crop Insurance: 2010-2016
Insurance Product |
2010 |
2011 |
2012 |
2013 |
2014 |
2015 |
2016 |
Total |
$2,174,674 |
$19,995,778 |
$19,438,568 |
$11,899,745 |
$14,786,426 |
$16,454,651 |
$10,253,562 |
WFRP/AGR/ AGR-L |
$34,362 |
$27,903 |
$39,688 |
$28,639 |
$28,975 |
$411,013 |
$2,759,608 |
LRP Feeder Cattle |
$1,077,701 |
$1,832,857 |
$1,473,919 |
$1,327,360 |
$2,902,341 |
$2,398,240 |
$2,352,417 |
LRP Fed Cattle |
$162,755 |
$222,279 |
$154,428 |
$120,860 |
$268,902 |
$361,909 |
$471,374 |
LRP Lamb |
$345,691 |
$1,304,964 |
$1,933,299 |
$241,342 |
$830,271 |
$33,737 |
$130,717 |
LRP Swine |
$123,512 |
$192,529 |
$73,894 |
$15,718 |
$49,129 |
$21,688 |
$30,810 |
LGM Cattle |
$9,561 |
$10,254 |
$629 |
$2,230 |
$12,871 |
$2,686 |
$14,193 |
LGM Swine |
$210,429 |
$183,792 |
$141,075 |
$264,569 |
$229,531 |
$180,155 |
$206,862 |
LGM Dairy Cattle |
$210,663 |
$16,221,200 |
$15,621,636 |
$9,899,027 |
$10,464,406 |
$13,045,223 |
$4,287,581 |
LGM Dairy insurance first became available in 2008. In 2011, the program was expanded from the previous 31 states to all 48 contiguous states and subsidy began to be provided for LGM Dairy. LGM Dairy sales have been halted at times due to reaching the allocated underwriting capacity. The 2014 Agricultural Act (Farm Bill) provided for the creation of the Margin Protection Plan (MPP), as a farm program for dairy. Producers are not allowed to participate in both the LGM Dairy and MPP at the same time and there are rules that once producers enroll in MPP, they are committed until the end of the MPP program which is the end of 2018. MPP first became available at the end of 2015, which can be seen in the LGM-Dairy expense capacity use in the table above.
Livestock insurance under Federal crop insurance was first allowed in accordance with the Agricultural Risk Protection Act (Farm Bill) in 2000. The following table shows livestock coverage under the LGM and LRP insurance plans from the time of inception in 2003. Livestock covered under the WFRP plan of insurance is not included in these totals, but is not a large amount.
Livestock Insurance Experience: All Years of Availability
Year |
Liability |
Total Premium |
Subsidy |
Indemnity |
Loss Ratio |
2003 |
$23,115,438 |
$1,269,031 |
$93,693 |
$328,318 |
0.26 |
2004 |
$278,567,984 |
$9,400,247 |
$824,788 |
$7,266,584 |
0.77 |
2005 |
$155,412,863 |
$5,067,399 |
$288,840 |
$1,838,726 |
0.36 |
2006 |
$189,529,859 |
$4,927,801 |
$302,033 |
$2,887,094 |
0.59 |
2007 |
$109,511,064 |
$3,205,044 |
$165,476 |
$2,332,570 |
0.73 |
2008 |
$244,497,751 |
$7,619,444 |
$642,351 |
$9,757,765 |
1.28 |
2009 |
$107,860,581 |
$4,157,358 |
$367,084 |
$8,434,371 |
2.03 |
2010 |
$185,784,534 |
$6,229,575 |
$563,496 |
$2,108,614 |
0.34 |
2011 |
$1,066,786,768 |
$34,128,241 |
$11,790,010 |
$4,281,695 |
0.13 |
2012 |
$1,149,803,366 |
$29,832,330 |
$10,165,447 |
$38,362,113 |
1.29 |
2013 |
$939,067,419 |
$23,704,903 |
$8,724,213 |
$22,692,904 |
0.96 |
2014 |
$1,040,593,521 |
$22,787,933 |
$6,606,344 |
$10,506,914 |
0.46 |
2015 |
$1,293,621,279 |
$32,825,201 |
$11,420,344 |
$25,416,770 |
0.77 |
2016* |
$533,568,817 |
$16,023,201 |
$4,183,245 |
$20,616,501 |
1.29 |
2017* |
$564,036,925 |
$18,185,470 |
$4,436,357 |
$1,780,770 |
0.10 |
*2016 and 2017 are incomplete. Data as of July 11, 2017. |
Program Growth: Crops and Crop/Type Programs Insured
The Federal crop insurance program has seen significant growth in both the crops and crop types covered and insured since 2000. The number of crops insured increased 10 percent from 2000 to 2017, to a total of 123 insurable crops. From the chart below, you can see some slight decreases in the number of crops. However, there was no real decrease in offerings. The reason for this ‘decrease’ is a restructuring initiative that has moved some crops to a more general category such as naval oranges being moved to a crop category called oranges with a type of navel. This initiative is the Acreage and Crop Reporting Streamlining Initiative, which is targeted to streamline producer reporting for Federal crop insurance purposes and participation in other USDA programs.
The number of insurable crop/type combinations for individual commodities, at 551 in 2017, increased nearly 70 percent from 2000. WFRP insurance also became available in 2015; expanding in 2016 to become the first Federal crop insurance program to be made available nationwide in all states and counties. For farms meeting eligibility requirements1, WFRP covers revenue from all commodities on the farm, including certified organic and specialty crop commodities. The following table shows the growth of individual insurance program offers by year since 2000 and includes all crops and livestock.
Federal Crop Insurance: Number of Crops and Types Insured*
Year |
Crops Insured |
Types Insured |
Total Crop/
Types Insured |
2000 |
112 |
254 |
325 |
2001 |
114 |
266 |
340 |
2002 |
117 |
283 |
358 |
2003 |
120 |
300 |
376 |
2004 |
120 |
318 |
393 |
2005 |
120 |
328 |
402 |
2006 |
119 |
345 |
418 |
2007 |
124 |
344 |
427 |
2008 |
126 |
358 |
440 |
2009 |
128 |
354 |
438 |
2010 |
128 |
399 |
482 |
2011 |
132 |
409 |
488 |
2012 |
131 |
427 |
507 |
2013 |
129 |
425 |
517 |
2014 |
124 |
454 |
542 |
2015 |
123 |
457 |
543 |
2016 |
126 |
460 |
547 |
2017 |
123 |
473 |
551 |
*Includes all crops and livestock. Excludes Whole-Farm Revenue Protection |
Overview of Program Performance
The Act requires the Federal crop insurance program to operate in an actuarially sound manner, with premium rates sufficient to cover anticipated losses plus a reasonable reserve. An industry standard measure of performance in insurance, the loss ratio is total indemnity divided by total premium. It is used to measure the overall performance of the crop insurance program. This represents the amount of indemnity paid per dollar of premium collected. For example, a loss ratio of 0.90 means that for every dollar of premium collected, 90 cents was paid in indemnities.
Period |
Average Loss Ratio |
5-Year (2012-2016) |
0.91 |
10-Year (2007-2016) |
0.80 |
15-Year (2002-2016) |
0.83 |
20-Year (1997-2016) |
0.85 |
The table to the right provides average loss ratios for the crop insurance program over recent periods of time, ranging from a low of 0.80 (over the last 10 years) to a high of 0.91 (over the last 5 years).
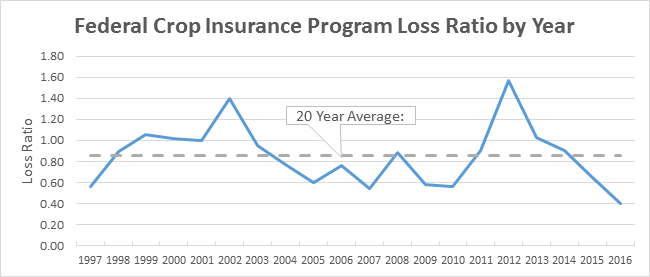
The chart below includes annual loss ratios from 1997 to 2016. As shown, the loss ratio varies from year to year, primarily driven by lack of moisture or excess moisture. These weather extremes can be widespread when they occur, as was the case with the 2012 drought when significant crop damage resulted in a loss ratio in excess of 1.0. In other years, such as 2016, loss events are isolated, resulting in a loss ratio well below 1.0. Given the annual variation in loss ratios, program stability and actuarial soundness is measured based on the historical average. The 20 year average loss ratio for the crop insurance program is 0.85, representing a financially stable and actuarially sound insurance program as required by the Federal Crop Insurance Act.
The chart below includes annual loss ratios from 1997 to 2016, with a 20 year average of 0.85 representing a financially stable and actuarially sound insurance program as required by the Federal Crop Insurance Act.
Federal Crop Insurance’s Improper Payment Rate
The government provides a statistical measure of the amount of improper payments made for government programs as a quality measurement to assure the prudent use of taxpayer dollars. The Risk Management Agency has been diligent in identifying areas that needed additional internal controls to prevent improper payments, resulting in a statistically measured improper payment rate of 2.02 percent in 2016, less than half of the 4.08 percent from 2012.
Federal Crop Insurance: Improper Payment Rate
| Year |
2012 |
2013 |
2014 |
2015 |
2016 |
| Improper Payment Rate |
4.08% |
5.23% |
5.58% |
2.20% |
2.02% |
1 An insurance liability (coverage) limit of $8.5 million currently exists.
Contact Information
For more information, contact RMA Public Affairs.
|